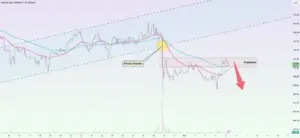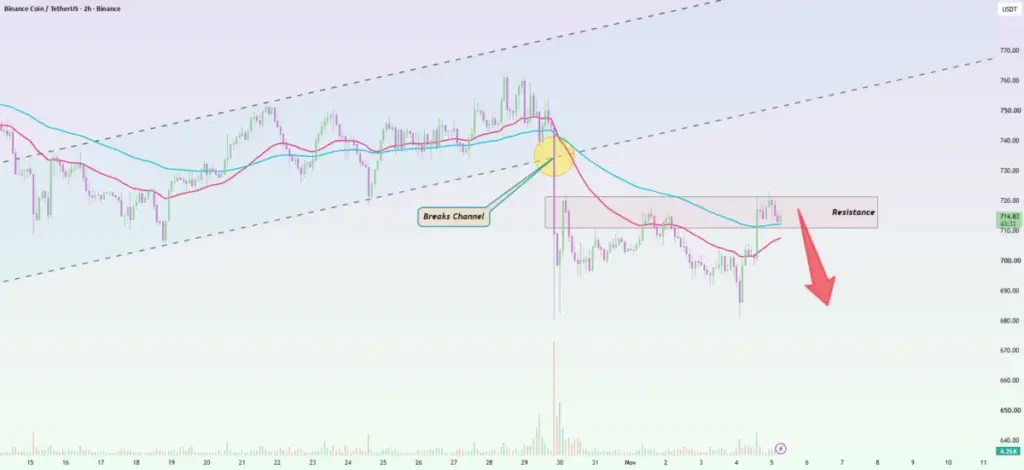
Binance Coin (BNB) is currently mounting a recovery effort following a recent wave of selling pressure across the digital asset markets, yet its broader two-hour market structure remains fundamentally vulnerable. The ongoing price correction comes in the wake of a decisive breakdown from a previously well-established ascending channel, a technical development that has altered the short-term outlook for traders and market participants tracking the asset’s price action.
As the broader cryptocurrency market navigates a complex period of macroeconomic uncertainty and shifting liquidity dynamics, BNB has managed to retrace a portion of its recent losses. However, this upward momentum is now encountering a formidable technical barrier. Price action has officially returned to a heavily contested overhead supply zone ranging between $710 and $722, an area where historical trading volume indicates strong selling interest. Within this crucial boundary, buyers are visibly struggling to sustain the necessary momentum to force a definitive breakout, casting a shadow over the sustainability of the current recovery rally.
Despite the recovery attempts observed over recent trading sessions, repeated bullish failures near the $720 threshold strongly suggest that market sellers continue to actively defend this territory. Order book dynamics and price rejections in this region illustrate that overhead supply remains thick, as profit-takers and short-sellers step in to cap upward movements. This persistent resistance highlights the fragile nature of the current rebound, leaving market participants closely monitoring whether buyers can muster enough volume to absorb the incoming sell orders or if the broader downward trend will resume its course.
Compounding these technical headwinds, current derivatives positioning data introduces an additional layer of concern for market stability. Market analytics reveal that approximately 70 percent of Binance BNB perpetual contract accounts are currently positioned on the long side. This heavily skewed long-to-short ratio indicates a crowded bullish sentiment among retail and institutional derivatives traders alike. Concurrently, open interest across BNB perpetual markets has been visibly declining, signaling that the recent recovery is not being heavily backed by fresh capital inflows, but rather sustained by speculative leverage.
Market historians and technical analysts note that such lopsided positioning environments can often precede sharp, volatile corrections. If the overhead resistance zone continues to hold firm and prices begin to drift lower, this crowded long positioning could exacerbate downward pressure. A sudden wave of long liquidations could make any upcoming pullback significantly more aggressive over the coming trading sessions as leveraged traders are forced to exit their positions to manage margin requirements.
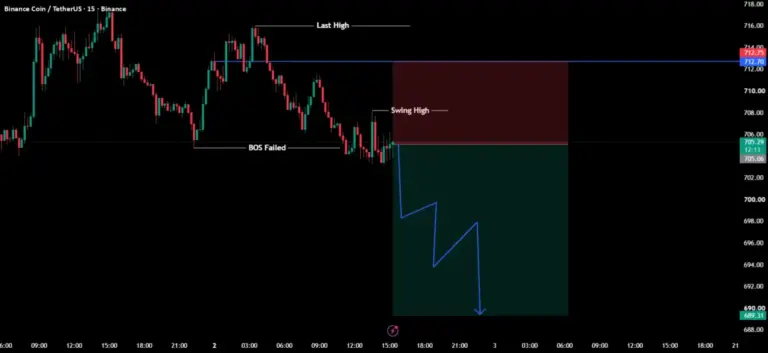
Looking at the immediate technical roadmap, market technicians have mapped out several critical levels that are likely to dictate the near-term trajectory of the asset. A confirmed rejection from the $715 to $722 resistance zone, followed by a decisive breakdown beneath the immediate support floor at $710, could expose the psychological $700 level to renewed selling pressure. Should the $700 threshold fail to hold against sustained selling volume, the asset could quickly slide further down toward the more robust $685 to $690 support area, where buyers previously established a firmer footing during earlier corrections.
Conversely, the prevailing bearish outlook and the risk of a sharp liquidation-driven pullback would be significantly weakened if BNB manages to orchestrate a high-volume breakout and subsequently hold above the upper boundary of the resistance band, specifically between $722 and $725. A sustained acceptance of prices above this zone would invalidate the immediate bearish thesis, signaling that buyers have successfully absorbed the overhead supply and are ready to challenge higher price targets.
For the immediate future, the preferred market scenario shared by technical observers points toward a continuation of the range-bound rejection pattern. This outlook favors a rejection around the $715 to $722 resistance zone, which would pave the way for a retracement down toward the $700 psychological mark, with a potential extension toward the lower support band spanning from $685 to $690 if selling momentum accelerates.
Disclaimer: The information and publications provided in this report are not meant to be, and do not constitute, financial, investment, trading, or other types of advice or recommendations supplied or endorsed by TradingView or the reporting publication.
 Crypto Investing & Trading
 Crypto Investing & Trading
 Crypto Investing & Trading