Financial market analysts often look beyond the initial momentum of a breakout to determine whether a sustained trend is forming or if a false move is underway. A central concept in this technical evaluation is the market retest, a dynamic process that checks whether a broken price level can successfully take on a new structural role. When an asset’s price breaks above an established resistance level, a later pullback may find support in that very same geographic zone on the chart. While the initial break creates the structural possibility of a shift in market psychology, the actual price response during the subsequent pullback provides the concrete evidence needed to evaluate whether that role change is truly holding.
Before any assessment of a retest can be made, market participants must accurately identify the foundational level in question. Analysts typically look for a historical price area where earlier advances repeatedly stalled, establishing a firm ceiling. This must then be followed by a completed candle closing cleanly above that threshold. Relying solely on a temporary wick piercing through resistance provides much weaker evidence of a structural shift, as price frequently finishes the session back inside its previous trading range, leaving the original barrier intact.
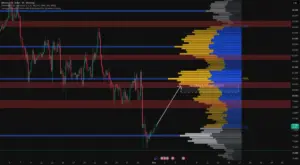
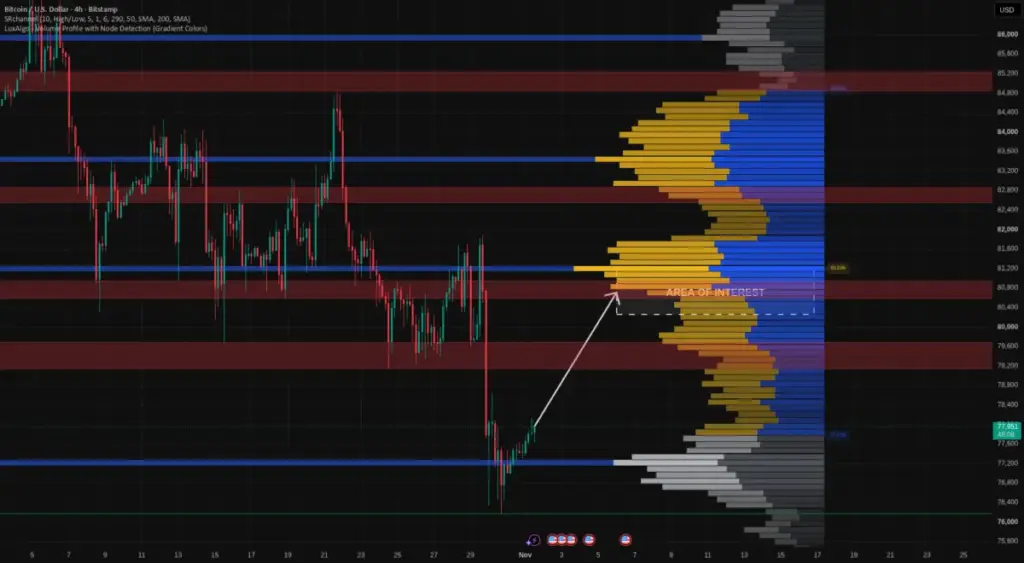
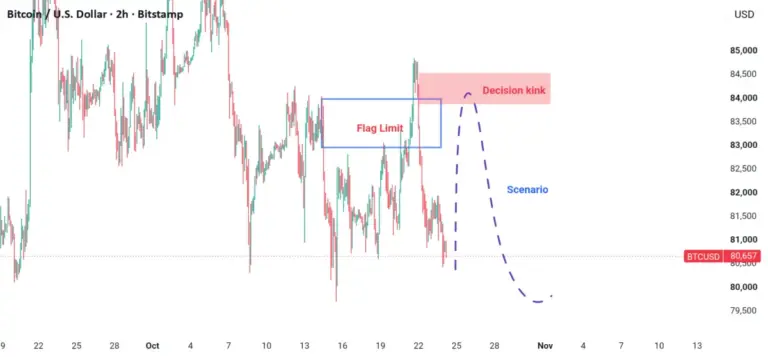
For a comprehensive weekend market review, the Bitcoin against the United States Dollar (BTCUSD) four-hour chart serves as an effective case study to illustrate the vital importance of market context. The recent price action on this timeframe features a sharp downward decline followed by a modest, measured rebound. Within this structure, a specific supply zone ranging between 80,251 and 81,156 has emerged as a key area for technical study. This zone is heavily underpinned by the largest volume shelf in the provided volume profile, alongside prior historical chart extremes that previously influenced market direction.
However, market observers emphasize that simply identifying this contextual zone does not establish a successful resistance-to-support role change. For such a transformation to be validated on the chart, price would first need to reclaim the zone decisively with a completed candle close above its upper boundary. Only after achieving this milestone would a subsequent return to test the area from above provide meaningful technical data.

Once a potential retest is underway, analysts closely observe how the pullback behaves in real-time. A healthy retest of a newly converted support level often displays specific behavioral characteristics. These include less forceful downward candles, overlapping price action clustering near the former resistance, and session closes that either hold steady above the area or quickly recover it after a brief dip. While a minor wick pushing into the zone can remain fully compatible with support holding firm, repeated closes beneath the threshold, coupled with persistent difficulty in reclaiming it, significantly weaken the bullish interpretation of the level.
Evaluating this sequence requires strict adherence to completed four-hour candles up to the most recently finished bar. The analytical checklist follows a specific chronological order: an established resistance, a decisive close above it, a subsequent return to the area from above, and a clear price response moving away from the zone. Analysts stress that any unfinished candle must be kept entirely out of the assessment to avoid premature conclusions. A mere touch of the level does not confirm support, and even a convincing initial response can ultimately fail as market conditions evolve.
A common pitfall among traders is assuming that every broken market level is destined to be revisited and retested. In reality, market price action can easily continue its directional journey without returning to the breakout zone, or it can return and break straight through it without pausing. Neither the revisit itself nor a successful hold of the level is ever guaranteed in technical analysis.
To refine the study of these market mechanics, analysts frequently review historical chart examples, carefully recording the exact evidence available at each completed candle. Before evaluating the subsequent price action, researchers define what conditions would invalidate the proposed role change and establish hypothetical risk parameters. By intentionally incorporating historical instances of failed retests and breakouts with no return, market observers ensure that their technical study remains objective rather than serving merely as a collection of selectively successful examples.
As trading desks and technical analysts continue to monitor major digital asset pairs like BTCUSD, the disciplined observation of volume profiles, completed candle closes, and structural role reversals remains a cornerstone of professional market analysis.
 Crypto Investing & Trading
 Crypto Investing & Trading
 Crypto Investing & Trading