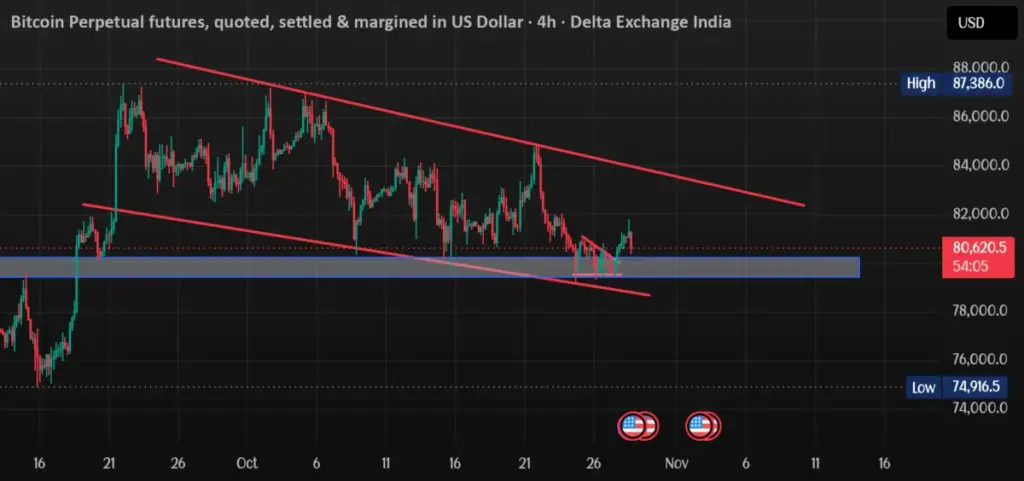
Bitcoin continues to capture the attention of global financial markets as traders and technical analysts closely examine its latest movements on the four-hour time frame. Following a period of notable volatility and price discovery, the leading cryptocurrency is exhibiting clear technical boundaries that are expected to dictate its short-term trajectory. Market observers tracking the asset’s recent behavior have identified a critical demand zone, suggesting that the digital asset may soon test specific price floors before attempting any substantial upward continuation.
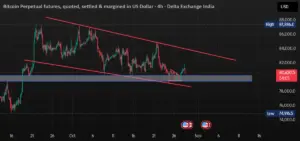
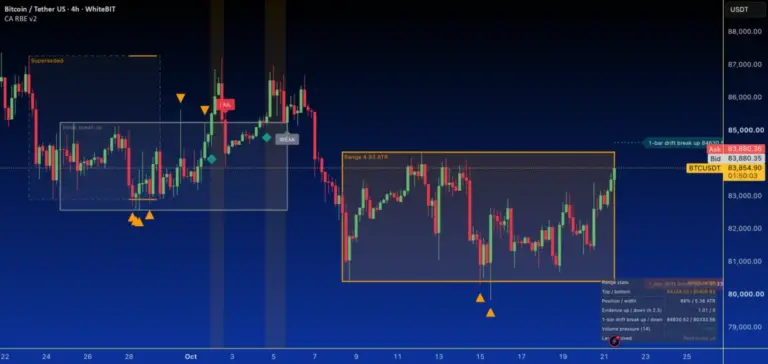
According to recent chart analysis focusing on the 4-hour interval, Bitcoin appears poised to establish a firm foundation of support within the $79,800 to $80,500 price corridor. This specific range has emerged as a focal point for market participants evaluating potential accumulation areas. As price action fluctuates, traders are monitoring whether incoming volume will successfully absorb selling pressure inside this established band, thereby preventing a deeper correction and providing the necessary momentum for a subsequent rebound.

On the opposing side of the current trading range, overhead supply remains a significant factor for market participants to navigate. Chart patterns indicate that the upper boundary for Bitcoin’s immediate price action lies between the $82,500 and $83,000 resistance levels. This ceiling represents a formidable barrier where previous buying momentum has encountered selling interest. For the cryptocurrency to break out of its current consolidation pattern and resume a broader bullish trend, decisive volume will be required to pierce this resistance zone and sustain prices above the $83,000 threshold.
The interplay between these identified support and resistance zones highlights the delicate balance currently governing the cryptocurrency market. Technical analysis across short-term horizons, such as the 4-hour chart, often reflects the immediate sentiment of active market participants, balancing the actions of short-term speculators against the broader positioning of longer-term investors. As Bitcoin navigates this narrow corridor, market analysts emphasize the importance of monitoring how price reacts upon approaching either the lower support zone around $79,800 to $80,500 or the upper resistance barrier near $82,500 to $83,000.
Chart patterns and trend analysis remain vital tools for traders attempting to decipher market direction during these phases of consolidation. However, market dynamics can shift rapidly in response to external economic data, liquidity changes, and broader financial market sentiment. Consequently, participants across the digital asset ecosystem continue to evaluate these technical levels with caution, recognizing that a breakout or breakdown from the current range could set the tone for Bitcoin’s next major directional move.
 Crypto Investing & Trading
 Crypto Investing & Trading
 Crypto Investing & Trading